Contractor Market Brief 005 | September observation, November 2 release
September construction spending fell 1.9% from August to a $2.186 trillion seasonally adjusted annual rate. The split matters more than the headline: private residential spending fell 5.5%, while private nonresidential spending rose 1.1%. Both compare with revised August estimates in the Census Bureau’s November 2 release.[1]
If your company bids both residential and commercial work, review the two pipelines separately this week. Do not reduce every estimate by the national headline or move a crew on the strength of one monthly reading. Check signed work, qualified bids, job costs and the next available crew date for each line before changing capacity.
The September work mix
| U.S. construction category | September 2026 rate | Change from revised August | What to check locally |
|---|---|---|---|
| Total construction | $2,186.1 billion | -1.9% | Compare your own bid pipeline by service, not with the national total. |
| Private residential | $848.8 billion | -5.5% | Separate new-build work, improvements and ordinary repair in your records. |
| Private nonresidential | $790.6 billion | +1.1% | Review actual commercial bids, qualifications and payment terms. |
| Public construction | $546.8 billion | -0.1% | Look for issued local solicitations, not an assumed public-work surge. |
Source: Census Bureau, September 2026 construction spending release, November 2, 2026. Dollar figures are seasonally adjusted annual rates, not dollars spent during September. Changes use revised August estimates. The public change has a 90% confidence interval of ±1.3 percentage points, which includes zero.[1]
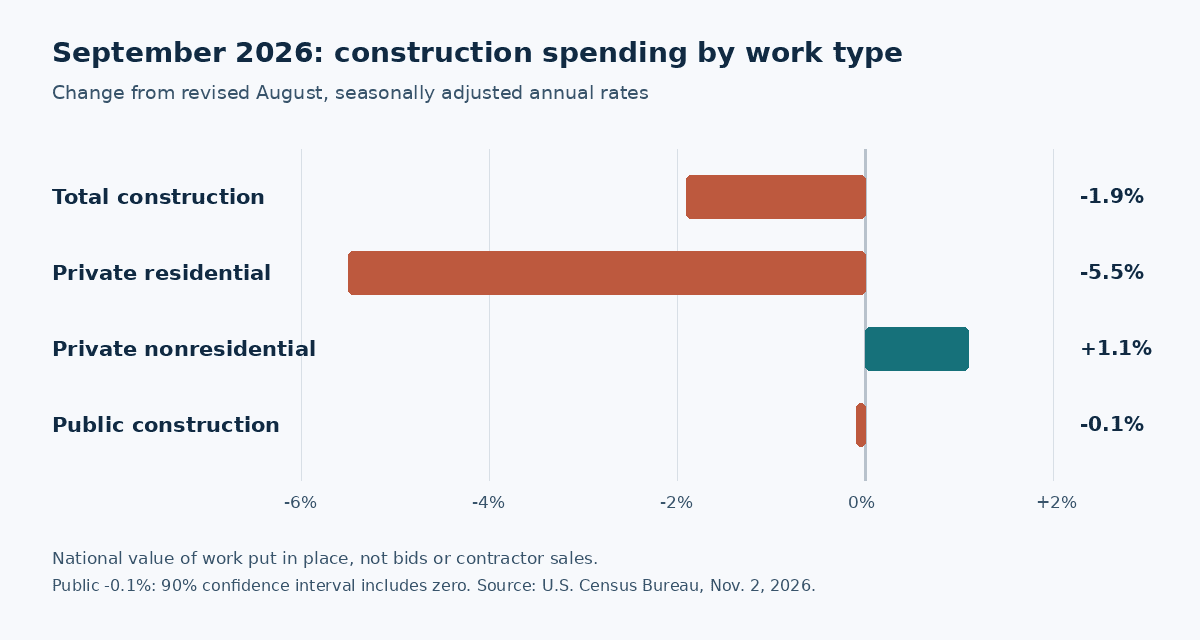
The total decline exceeds the Census release’s 90% sampling interval of ±0.7 percentage points. So do the private residential decline (±1.3) and private nonresidential increase (±0.5). The public reading’s interval includes zero, leaving its monthly direction uncertain. These preliminary estimates describe national work installed, not bids that an individual contractor can win.[1]
The residential line needs care. Census includes private residential improvements in that total, but its main release table does not break those improvements into a separate row. New single-family construction in that table was $403.4 billion at an annual rate, effectively unchanged from revised August. The 5.5% residential decline should not be presented as a measured fall in every remodeling or single-family trade.[1]
Census counts construction installed at a site during the month, including major replacements and renovations on projects that may have begun earlier. It excludes routine maintenance and repairs. A service contractor’s repair calls therefore cannot be read directly from this spending series. Census classifies private and public work by ownership during construction. The figures describe work already put in place, not new permits, unawarded bid opportunities or payments to your firm.[2]
Commercial is not one lane either
Within private nonresidential work, office construction rose 5.5% from August to a $145.6 billion annual rate. Private manufacturing slipped 0.3% to $167.2 billion; private commercial, the Census category that includes retail and warehouses, slipped 0.3% to $115.9 billion. Office was also up 39.5% from September 2025, while manufacturing was down 17.9%. The increase in private nonresidential spending does not describe every building type.[1][2]
Census places data-center buildings within the office category. The office rise is not proof that a data-center contract is available in your market, and this release table does not assign the month’s office change to data centers. Ask for the actual project, bid package, bonding and payment requirements before treating that national line as a lead.[1][2]
A bid review for this week
Pull open estimates and signed work for residential construction or improvement jobs on one side and commercial or public projects on the other. Keep routine service calls in their own column; the Census series excludes maintenance and repair. For each lane, record the count and value of qualified open bids, signed jobs scheduled, estimated labor hours, direct job costs and expected contribution. Mark which bids have a real decision date and which have no confirmed start.[2]
For each lane, count accepted estimates among estimates whose decision windows have closed, then divide by the number of estimates in that same closed-window group. Calculate a rate only when that count is known and greater than zero; otherwise record “not enough decided estimates” and review the counts later. Compare expected contribution per crew-day after direct labor, materials, subcontractors and travel, using the same costing rules for both lanes. This gives you a better basis for assigning the next crew opening than a national percentage change.
Then choose a narrow response. If residential bids have slowed but contribution remains sound, test the inquiry source and estimate follow-up before cutting price. If commercial opportunities have increased, check crew fit, procurement access and cash exposure before shifting labor from work already sold. If neither lane changed in your own records, leave the schedule alone and check again after another observation. This is an operating test, not a Census forecast of your sales.
For a local bid, require a named buyer or procurement notice, a defined scope, a deadline and a realistic crew window. Record the result beside your original estimate. The next national construction spending release, for October, is scheduled for December 1; the local bid record should govern your near-term decisions.[1]
Source and method
Census observation: September 2026. Publication: November 2, 2026. Retrieved November 2. Figures come from the Census release and its Table 1; percent changes are the agency’s published rounded comparisons with revised August. These are national, nominal-dollar, seasonally adjusted annual rates, not inflation-adjusted measures of physical construction volume. Because September is preliminary, later releases can revise these comparisons. No local bid inventory, contractor revenue, margins or project awards were measured. The owner review is our decision framework, not a finding from Census.[1][2]
Sources
[1] Census September 2026 construction spending, released November 2, CB26-176