Echelon Contractor Market Brief 004 · Week of October 26, 2026
The remodeling market outlook for 2027 is modest growth in spending, not a collapse in demand. Harvard’s October 22 forecast projects 1.5% annual growth by the third quarter of 2027. Meanwhile, NAHB reports improving inquiries and backlog sentiment, and Houzz reports stronger expectations among construction firms. For contractors, the question is which jobs will contribute enough after direct costs. [1][2][5]
Check where your own business is constrained: qualified inquiries, estimate acceptance, or capacity to deliver signed work. The weekly worksheet below helps choose a next move.
What changed in the remodeling outlook?
| Indicator and period | Latest reading and change | What it tells an owner |
|---|---|---|
| Harvard LIRA, released October 22; forecast through 2027 Q3 | Rolling annual spending: $524 billion in 2026 Q4 to $527 billion in 2027 Q3. Annual growth slows from 2.4% to 1.5%. [1] | A national forecast in nominal dollars. Both points come from the October 22 forecast. |
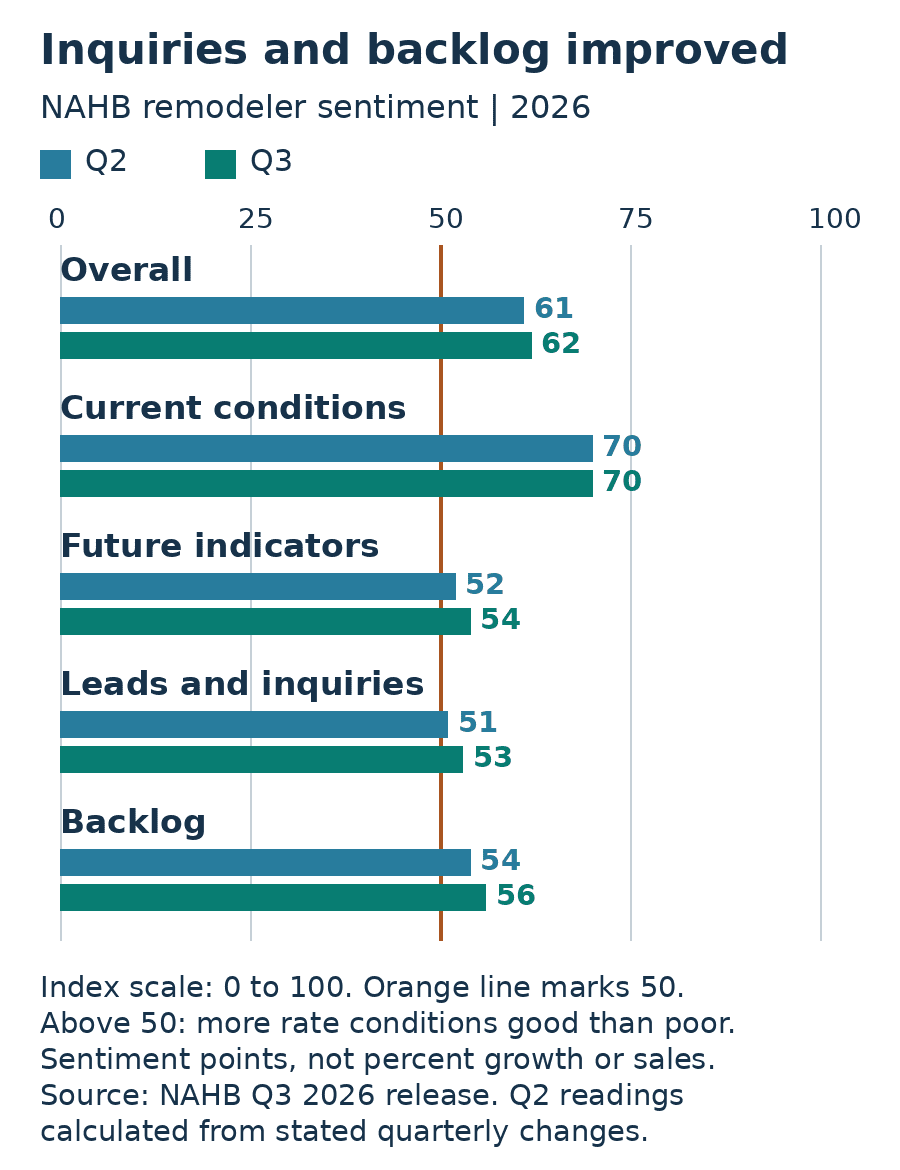
| NAHB remodeling sentiment, 2026 Q3 versus Q2 | Overall index: 61 to 62. Current conditions: unchanged at 70. Future indicators: 52 to 54. [2] | Current conditions remain stronger than future indicators, but the forward-looking index improved. |
| NAHB inquiries and backlog, 2026 Q3 versus Q2 | Inquiries: 51 to 53. Backlog: 54 to 56. [2] | Both sentiment measures improved; compare with your own inquiry counts. |
| Houzz construction outlook, 2026 Q4 | Expected Business Activity Indicator: 74, up 13 points. Strongest reading since early 2022. [5] | Construction respondents expect more activity; this is a sentiment reading, not booked work. |
Spending can grow while growth slows
Harvard’s forecast has spending rising slightly while its annual growth rate declines. Its release describes spending as hovering around $525 billion; the chart places the rolling annual total at $527 billion in 2027 Q3. That total covers four quarters of spending, not spending during one quarter. [1]
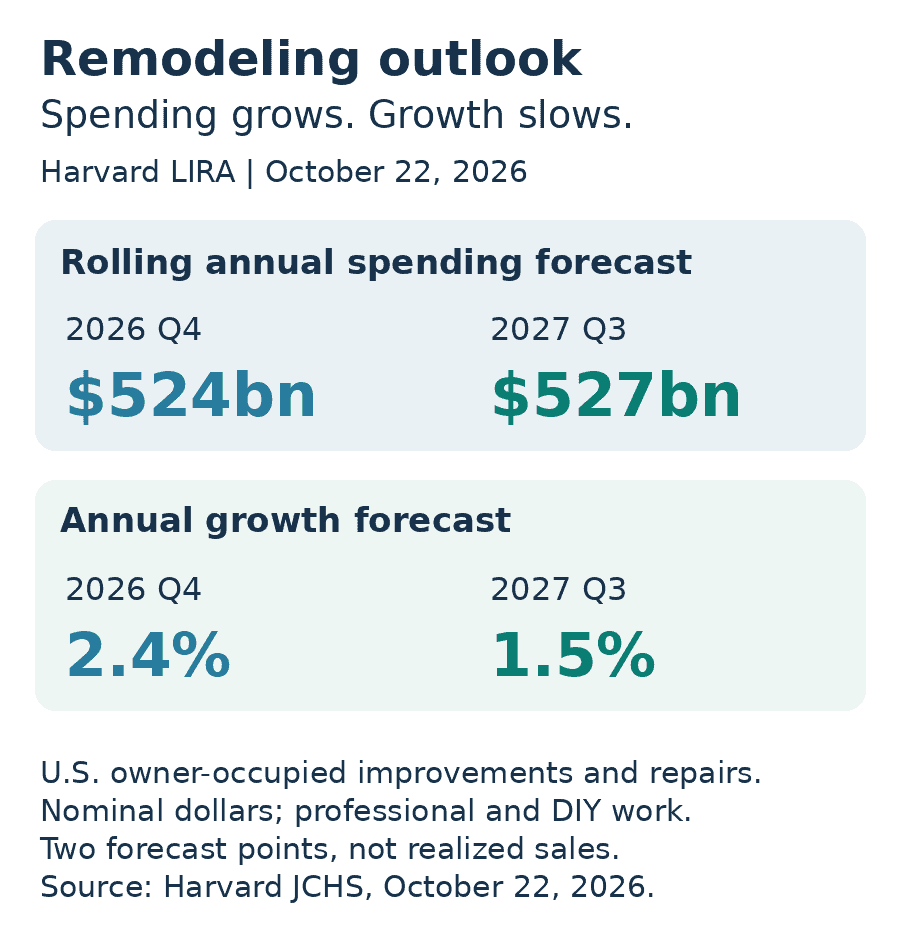
The Leading Indicator of Remodeling Activity covers professional and do-it-yourself improvements and repairs to owner-occupied homes, not rentals. It tracks national spending in nominal dollars, not job counts or local trade demand. [3]
Use that national forecast when setting assumptions, then test them against your own sales. If revenue rises because quoted prices rose, inspect completed-job costs before treating the increase as stronger business performance.
Inquiries improved. Check whether your business shares that gain.
NAHB’s current conditions index held at 70 in Q3, while its future index rose to 54. Inquiries and backlog each gained two points. An index above 50 means more remodelers rate conditions good than poor; it does not report the percentage of firms growing. [2]
Houzz adds another positive signal. Its construction respondents’ expected-activity reading rose 13 points to 74, reflecting stronger expectations for inquiries and newly committed projects. Architecture and design firms reported a more restrained outlook. Houzz also reports continuing cost pressure and cautious clients. [5]
Houzz measures firms’ expectations, while Harvard forecasts homeowner spending. The 74 is an index reading, not a percentage chance of winning work.
For your company, compare inquiries with the same seasonal period and service mix. If opportunities are improving but sales are not, review lost estimates before assuming you need a larger advertising budget. If qualified inquiries really are falling, inspect your acquisition sources; our local SEO guide for contractors explains how to choose a visibility fix rather than changing everything at once.
A weekly worksheet for choosing the next move
Use one consistent review period and a matching comparison period. Keep signed work separate from estimates awaiting a decision. The actions below are operating guidance, not survey thresholds.
| What changed? | Check before acting | Next move to test |
|---|---|---|
| Qualified inquiries fell | Compare inquiry sources, requested services, geography, and seasonality. Record actual counts. | Repair the weakest relevant acquisition source. Keep the offer and service area specific. |
| Inquiries held, but fewer estimates became signed jobs | Calculate acceptance for comparable estimate groups. Review price objections, response time, scope clarity, and unresolved follow-ups. | Fix the estimate or follow-up problem before buying more inquiries. |
| Revenue rose, but job contribution fell | Compare revenue less direct job costs. Check labor hours, materials, subcontractors, travel, and scope changes using consistent cost rules. | Correct pricing or job selection. Track contribution per constrained crew-day as well as per job. |
| Signed work exceeds reliable capacity | Map confirmed starts against available crews, supervision, equipment, and supplier commitments. | Adjust scheduling or capacity before promoting more of the same work. Confirm revised dates with customers. |
In your weekly notes, record: review dates, service category, qualified inquiries, estimates issued, signed jobs, reasons for losses, direct job costs, and the next crew opening. Assign one person to the chosen action and set the next review date. Compare estimates with similar decision windows so recent undecided quotes do not distort acceptance.
A worked example: more leads or better follow-up?
Suppose two comparable groups each contain 40 estimates with completed decision windows. The first produces 20 signed jobs; the second produces 14. Acceptance falls from 50% to 35%, even though the estimate count is unchanged. At an assumed $1,500 contribution per job, those groups represent $30,000 and $21,000 before overhead. These are illustrative figures, not industry benchmarks or a measured client result.
Review why six fewer customers signed: their stated reasons, the work quoted, prices, and response times. The example does not identify a cause; use what you find before buying more leads.
For commercial contractors: data-center backlog is a separate signal
ABC’s October 13 release puts September backlog at 8.7 months, up 0.2 months from August. Members under contract for data-center work averaged 11.3 months, three months more than members without it. Those firms made up 15% of survey respondents. Meanwhile, more than one in four respondents expected margins to contract over the next six months. [4]
Commercial firms considering data-center work should check qualifications, staffing, payment terms, and actual procurement opportunities. They can use Echelon’s data-center project reports and contractor routes to investigate specific projects. A qualification route is not an open contract.
What to watch before the next forecast
Harvard schedules its next LIRA release for January 21, 2027. Until then, your weekly inquiry, estimate, cost, and capacity records will change faster than the national forecast. [1] Recheck supplier quotes before extending estimates, and preserve agreed customer terms. Use the worksheet to decide which constraint deserves attention this week rather than treating every weak result as a marketing problem.
Remodeling outlook questions
Is remodeling spending expected to fall in 2027?
Harvard’s October 2026 forecast projects modest growth, with a 1.5% annual increase by 2027 Q3 and $527 billion in rolling annual spending. Those are national nominal-dollar projections, not a prediction of sales for an individual contractor. [1][3]
Are remodeling leads getting worse?
NAHB’s Q3 2026 inquiry sentiment index rose from 51 to 53. Sentiment improved; compare it with your own qualified inquiry counts. [2]
Why is Houzz more optimistic than Harvard?
Houzz reports construction firms’ expectations for business activity, while Harvard forecasts national homeowner improvement and repair spending. Houzz’s stronger expectations can coexist with slow national spending growth. [1][5]
Sources and method
Research cutoff: October 27, 2026. This issue combines a national spending forecast with remodeling sentiment, Houzz business expectations, and a separate commercial backlog survey. We retain each source’s period and measurement rather than combining them. Prior NAHB readings shown in the chart are calculated from the published Q3 readings and stated quarterly changes. Charts are Echelon visualizations of the cited figures. The worksheet and worked example are our analysis, not forecasts or survey findings.
- Harvard Joint Center for Housing Studies: Remodeling Spending Continues to Stagnate, October 22, 2026
- NAHB: Third-quarter remodeling sentiment and component changes
- Harvard: LIRA definitions and methodology
- ABC: September backlog and confidence, released October 13, 2026
- Houzz: Construction Outlook Hits Multiyear High Amid Cost Pressures, Q4 2026 Barometer